For generations, the London version of Monopoly has shaped our view of the capital's property landscape, from the humble brown of Old Kent Road to the dazzling blue of Mayfair. But what would it actually cost to build a real-life property empire on those famous squares today? Using the latest official house price data for 2025, we've calculated the staggering sums required to own a piece of the iconic board game in modern London.
The Price of Passing Go: A Snapshot of London's Market
The classic board offers a stark reflection of London's geographical wealth divide. The journey begins in the south-east, where Old Kent Road in the Borough of Southwark commands an average house price of £600,000 as of June 2025, according to the Office for National Statistics (ONS). Just a roll away, Whitechapel Road in Tower Hamlets presents a relative 'bargain' at £488,000. Moving north, the light blue set reveals Angel and Pentonville Road in Islington, both averaging £701,000.
The game's first significant jump comes with the green set. Euston Road, primarily in Camden, has an average price of £876,000, while the famous Fleet Street in the City of London sits at £881,476. This sets the stage for the eye-watering premiums of central Westminster.

The Westminster Premium: Where Every Square Costs a Fortune
From the orange set onwards, the board is dominated by the Borough of Westminster, and the price data reflects its elite status. A huge swathe of the game's most coveted addresses share the same average house price tag. Pall Mall, Whitehall, Northumberland Avenue, Bow Street, Marlborough Street, and Vine Street all average £1,035,000.
This premium extends to the red and yellow sets. The Strand, Trafalgar Square, Leicester Square, Coventry Street, and Piccadilly are all priced at the same Westminster average of £1,035,000. Even the bustling shopping meccas of Regent Street, Oxford Street, and Bond Street (Old & New) fall into this multi-million-pound bracket.
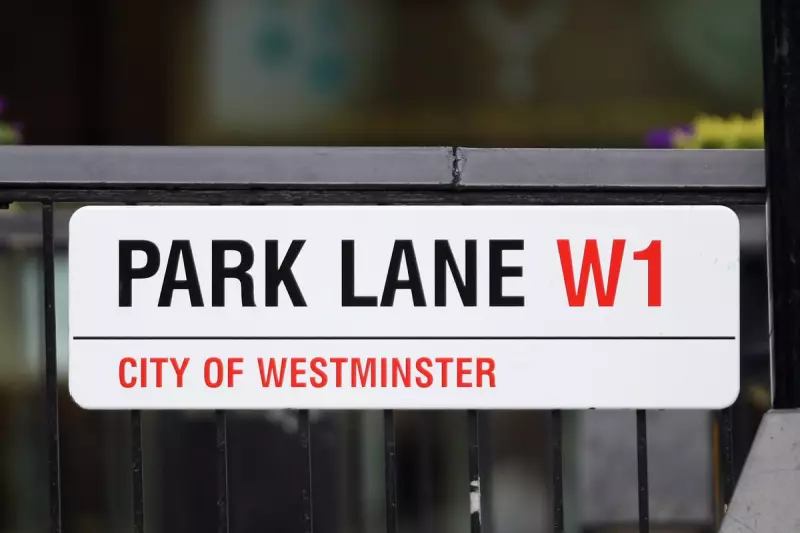
Park Lane and Mayfair: The Crown Jewels Remain Untouchable
True to the game's logic, the dark blue set represents the pinnacle. While the provided data lists an average for Westminster, specific price data for individual ultra-prime streets like Park Lane and Mayfair is often far higher than the borough average. These iconic addresses remain the most exclusive and expensive locations on the board, justifying their status as the game's most costly acquisitions. The ONS borough average for Westminster, repeated for these squares, is £1,035,000, but real-world transactions for prime properties here can reach many multiples of that figure.
The exercise reveals a fascinating truth: the 1935 game board still captures a fundamental reality of London's property market. The steep climb from the affordable south-east to the golden streets of the West End is not just a game mechanic—it's a financial reality for anyone dreaming of owning a piece of the Monopoly map in 2025.