
Trump's Second Term: A Year of Mixed Metrics in Charts
The first year of Donald Trump's second term as President of the United States has presented a complex and often contradictory picture, with data revealing significant shifts across immigration, the economy, and public sentiment. The Guardian has meticulously tracked these developments, compiling vital statistics that illustrate the social and political ramifications of this tumultuous period. While narratives abound, the story is perhaps most starkly told through charts and graphs, which offer a clear-eyed view of the administration's impact.
Immigration Enforcement Undergoes Drastic Transformation
One of the most pronounced changes has occurred in immigration policy. Under Trump's renewed leadership, enforcement has intensified, leading to a record number of individuals being held in Immigration and Customs Enforcement (ICE) detention who have no criminal history. This group now constitutes the largest segment of detainees, marking a significant departure from previous practices and highlighting the administration's stringent approach.
Additionally, the Trump administration has recently suspended visa processing for citizens from 75 countries, effectively banning entry from these nations. This move has affected numerous countries that were among the top issuers of visas in 2024, reshaping international travel and immigration flows in a profound manner.

Economic Performance Presents a Mixed Bag
On the economic front, Trump's promises of revitalisation have met with mixed results. Job growth has been notably lacklustre, failing to meet expectations despite the president's emphasis on economic improvement during his campaign. Meanwhile, inflation remains stubbornly high, although it has decreased from the peak levels seen during the Biden administration, indicating ongoing challenges in stabilising prices.
Energy costs have also seen divergent trends. Contrary to campaign pledges to halve electricity prices, average household electricity and natural gas prices have increased by nearly 5%. In contrast, gasoline prices have declined, offering some relief to consumers but underscoring the uneven nature of energy market developments.
Public Opinion and Market Reactions Diverge
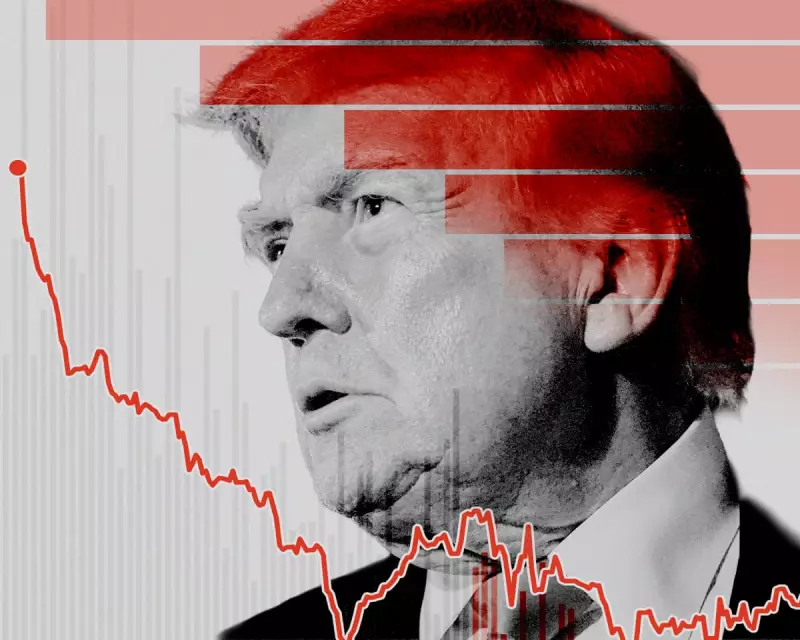
Public support for Trump's second administration has waned, with his approval rating steadily declining throughout the year. This downward trend reflects growing dissatisfaction among voters, potentially influenced by the administration's policies and the broader political climate.
Despite this unpopularity and ongoing uncertainty, particularly regarding tariff policies, the stock market has demonstrated resilience. The S&P 500 index recovered from initial volatility and continued to grow, reaching new record highs. This suggests that investor confidence has remained robust, even as public sentiment has soured.
In summary, the data from Trump's first year back in office paints a picture of significant policy shifts and economic contrasts, with immigration crackdowns, stalled job growth, and declining approval ratings juxtaposed against market gains and some energy price reductions. These metrics provide a comprehensive overview of a chaotic and transformative period in American politics.